ROI Calculation Methods: Simple vs Annualized Returns
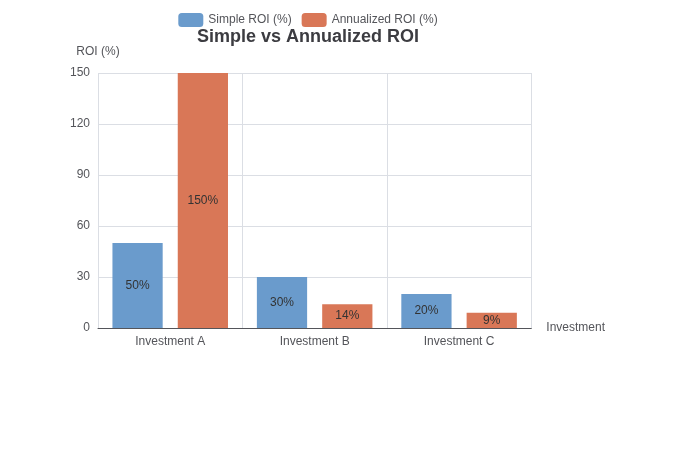
Here's a investment pitch I actually received: "We generated 50% returns last year." Sounds amazing, right? Until I asked how long they'd held the position. Four months. The annualized return was closer to 150% — but the headline number was 50%.
This is why understanding ROI calculation methods matters. The same investment can look great or mediocre depending on how you crunch the numbers. Let me show you the difference.
The Simple ROI Formula
Simple ROI is straightforward:
ROI = (Gain from Investment - Cost of Investment) / Cost of Investment × 100%Example: You invest $10,000, it's worth $12,000 after a year. Simple ROI = ($12,000 - $10,000) / $10,000 = 20%.
The problem: this formula ignores time. That same 20% gain over one year is great. Over five years, it's mediocre. Over ten years, it's barely keeping up with inflation.
Always ask: "Over what time period?" when you see any ROI figure.
Annualized Returns (CAGR)
CAGR — Compound Annual Growth Rate — accounts for time. It tells you what the equivalent annual return would be over the entire period:
CAGR = (Ending Value / Beginning Value)^(1/n) - 1

Where n = number of years
Same example: $10,000 to $12,000 over 1 year = 20% CAGR. But $10,000 to $12,000 over 3 years = ($12,000/$10,000)^(1/3) - 1 = 6.27% CAGR.
Same simple gain, wildly different annualized return. This is why comparing investments with different holding periods requires CAGR, not simple ROI.
Including Dividends and Fees
Real-world returns aren't just price appreciation. They include:
- Dividends: Cash payments from stocks. A stock that goes up 10% and pays 3% in dividends has a total return of 13%.
- Interest: For bonds or savings accounts
- Distributions: From mutual funds or ETFs
And they subtract:
- Trading fees: Commissions, spreads, bid-ask costs
- Management fees: Mutual funds average 0.5-1.5% annually; this directly reduces your returns
- Taxes: Depends on your jurisdiction and account type (tax-advantaged vs. taxable)
Always calculate your actual net return after all costs, not just the headline gain. A fund that returned 8% with 1.5% fees is worse than one that returned 7% with 0.1% fees.
What "Good" ROI Looks Like
Context matters enormously for interpreting ROI figures. Here are rough benchmarks:
- S&P 500 index fund: Historical average ~10% per year (before inflation)
- Bonds: Investment-grade corporate bonds: 4-6% historically
- Savings account: Whatever the current Fed rate is — currently 4-5%
- Real estate (rentals): 8-12% total return including appreciation is reasonable
- Business investment: Highly variable; 15-25% is often cited as good for small businesses
A "50% return" that took 7 years to achieve might be respectable for venture capital, but it's terrible for a savings account. Always compare apples to apples.
The Limitations of ROI
ROI is a useful metric, but it has blind spots:
1. Risk isn't measured: A investment that returns 20% with 50% chance of total loss looks great on ROI alone. Risk-adjusted returns (Sharpe ratio, Sortino ratio) are more meaningful.
2. Cash flow timing: $1,000 gained in year one is worth more than $1,000 gained in year ten due to present value. IRR (Internal Rate of Return) accounts for cash flow timing; ROI doesn't.
3. Capital requirements: A 100% return on $100 is fun, but it doesn't pay your bills. Absolute dollar gains matter for personal finance.
4. It's rearview-mirror focused: Past returns don't guarantee future results. A fund with 15% returns over the last 3 years might be due for a correction.
Practical Example: Rental Property
Let me show how different calculations give different pictures:
You buy a rental property for $200,000. You put $40,000 down (20%). First year:
- Rent collected: $18,000
- Operating expenses: $6,000
- Mortgage interest: $8,000
- Net operating income: $12,000
Simple cash-on-cash return: $12,000 / $40,000 = 30%. Sounds amazing.
But include equity buildup (~$3,000), appreciation (let's say 3% = $6,000), and subtract property management (if you hire it at 10% = $1,800), and your total return changes. Factor in vacancy, repairs, and capital expenditures, and reality sets in.
The point isn't that rental properties are bad — they're often good investments. The point is that a single ROI number without context is nearly useless.
How to Calculate Your Own ROI
For your personal investments, track:
- All money in: initial investment + any additional contributions
- All money out: dividends, interest, distributions received
- Current value: what it's worth today
- All fees paid: management, trading, taxes if tracked
The ROI Calculator on ToolMixr handles the basic math for you. For more complex scenarios — multiple cash flows, irregular timing — a spreadsheet with XIRR or a financial calculator is better.
Bottom line: never take an ROI figure at face value. Ask about the time period, what costs are included, and what risks were taken to achieve that return. The headline number is just the beginning of the story.