BMI Calculator: What Your Number Really Means
Let me start with a confession: according to BMI, LeBron James is obese. So is Michael Phelps. Arnold Schwarzenegger in his prime would have been in the overweight category.
The Body Mass Index was invented in 1832 by a Belgian mathematician named Adolphe Quetelet — not a doctor. It was designed to study populations, not individuals. And yet, 200 years later, it's the most commonly used metric for individual health assessment.
This isn't an attack on BMI being useless. It has value as a screening tool. But understanding its limitations prevents you from either panicking over a number that doesn't reflect reality or being falsely reassured by one that misses real risk.
How BMI Is Calculated
The formula is simple:
BMI = weight (kg) / height (m)²Or in imperial units: (weight in pounds × 703) / height in inches²
A 5'10" person at 180 lbs: (180 × 703) / (70)² = 25.8 BMI
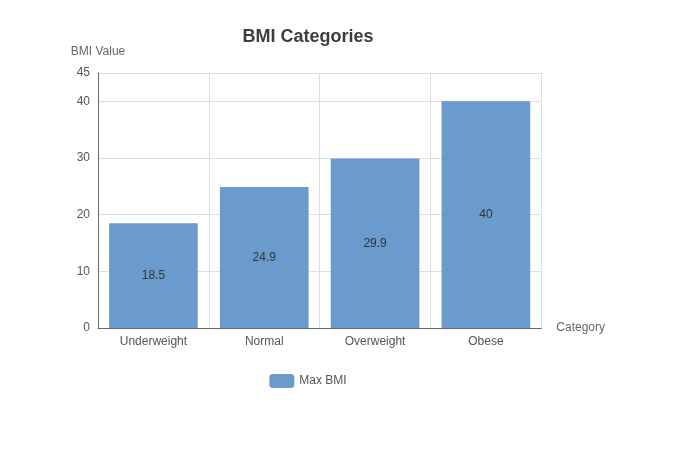
The WHO categories:
- Underweight: Below 18.5
- Normal: 18.5 - 24.9
- Overweight: 25 - 29.9
- Obese: 30 and above
Obese is further subdivided: Class 1 (30-34.9), Class 2 (35-39.9), Class 3 (40+).
The Fundamental Problem: It Doesn't Measure Body Composition
BMI only uses height and weight. It has no idea whether your weight is muscle, fat, bone, water, or anything else.
This matters because:
- Muscle is denser than fat: Two people at 6'0", 200 lbs can have vastly different body compositions. One might be 10% body fat; the other might be 25%.
- Athletes systematically get misclassified: NFL players, powerlifters, rugby players — the "obese" category is full of elite athletes with exceptional cardiovascular health.
- It ignores fat distribution: Belly fat (visceral fat) is more dangerous than fat in other areas. A "normal" BMI person with significant abdominal fat might be at higher health risk than an "overweight" person with fat primarily in their hips and thighs.
The Ethnicity Problem
Here's something that rarely gets discussed: BMI thresholds were developed based on white European populations. Research shows different ethnic groups have different health risks at the same BMI.
For example, people of South Asian, Southeast Asian, and East Asian descent have higher health risks at lower BMI values. The threshold for overweight might be more like 23 for these populations, and obesity at 27.5. Some health organizations have already adjusted their guidelines accordingly.
At the other end, Pacific Islanders and some African populations have been shown to maintain health at higher BMIs than the standard categories suggest.
When BMI Is Actually Useful
Despite its limitations, BMI remains in widespread use because it's:
- Free and easy: No equipment needed, just a scale and measuring tape
- Standardized: Same formula worldwide, allowing population comparisons
- Correlated with population health: At the population level, higher BMI does correlate with higher disease risk, even if it's imperfect for individuals
For large-scale studies and epidemiological research, BMI is perfectly adequate. It's screening individuals where it gets shaky.
Better Alternatives for Individual Assessment
If you want a more accurate picture of your health, consider:
1. Waist-to-height ratio: Measure your waist at navel level and divide by your height. A ratio above 0.5 suggests increased health risk. This accounts for dangerous visceral fat better than BMI.
2. Body fat percentage: Measured via bioelectrical impedance (scales), skinfold calipers, or DEXA scans. Ranges differ by age and sex, but generally:
- Essential fat (women): 10-13%
- Athletes (women): 14-20%
- Essential fat (men): 2-5%
- Athletes (men): 6-13%
3. Waist circumference: Simply measuring waist size is surprisingly predictive. Above 40 inches for men or 35 inches for women (non-pregnant women) correlates with higher metabolic risk.
4. DEXA scan: The gold standard for body composition. Expensive and not widely available, but gives you muscle mass, fat mass, and bone density.
For Children: Percentiles Matter
BMI for children and teenagers works differently. Because kids are still growing and developing at different rates, we use BMI-for-age percentiles.
A child in the 60th percentile for BMI-for-age is heavier than 60% of children of the same age and sex. This is compared to growth charts from a reference population.
Percentiles under 5th suggest underweight; over 85th suggests overweight; over 95th suggests obesity. But even this approach has limitations — early-maturing kids can have temporarily elevated BMI.
The Bigger Picture
Health is more than a number on a chart. It includes:
- Blood pressure, cholesterol, and blood sugar levels
- Cardiovascular fitness
- Mental health
- Sleep quality
- Physical activity levels
- Social connections
If your BMI says you're in the "overweight" category but you run 5 miles three times a week, have normal blood pressure, and feel energetic — the number is probably not telling you anything meaningful about your health.
On the flip side, a "normal" BMI doesn't guarantee health. Thin people can have type 2 diabetes, high cholesterol, and metabolic syndrome. The number alone misses this.
Using the Calculator Wisely
The BMI Calculator on ToolMixr gives you the number quickly. But consider it a starting point, not a verdict.
What to do with the result:
- If it's in the "normal" range and you have no other risk factors, that's reassuring
- If it's outside the normal range, use it as a prompt to look at other metrics: waist size, blood pressure, family history
- Whatever your BMI, lifestyle factors matter more than the number itself
BMI is a useful population screening tool that's often misused as an individual diagnosis. Understand what it measures (basically: how heavy you are relative to your height) and what it doesn't (anything about your actual body composition or health). Then use it accordingly.